Creating a PHP app to debug
A simple .php file
We start by creating a new local directory on our computer, that we open in VSCode (File -> Open Folder…). Then we create an index.php file in this directory. It will contain the said code to debug :
The docker image
We have to create a new docker image to install Xdebug into. For that, we create a new file called dockerfile (no extension for this one) containing the following commands :
Docker Compose
Still in the same directory, we create a new file named docker-compose.yml. Inside, we write the instructions to launch the container we just described :
Lines 6 to 10
Here we have only one service called app, which builds a container named tuto-xdebug from the dockerfile file located at the root of the current directory
Lines 11 to 14
The port number 80 of this container is exposed on the port number 80 of our computer. Then we create a link between our index.php file and the index.php file in the directory /var/www/html of the container. (That’s this directory the embedded apache server points to.)
Lines 15 to 16
Finally, we configure Xdebug. Docker provides a specific DNS address host.docker.internal to connect to its host.
Indeed, we could neither use localhost, because our VSCode instance is outside of docker, nor the IP address of our computer, because it changes depending on the network it’s connected to. I point out that it is Xdebug that connects to VSCode, not the other way around. By conventions, we connect Xdebug to port number 9000, but it's completely free, and if we wanted to spy on many containers simultaneously, we would have to distribute them on different ports.
Launching the container
Here we are, our application is ready. Let’s launch it! For that we need a terminal. We place ourselves at the root of our directory, and we type in the magic docker command : docker-compose up

We can now check that our small application works as expected by opening our favorite browser and going to the URL localhost?name=Julien.

We can notice that it works well and displays “Bonjour Julien !”
The VSCode extension
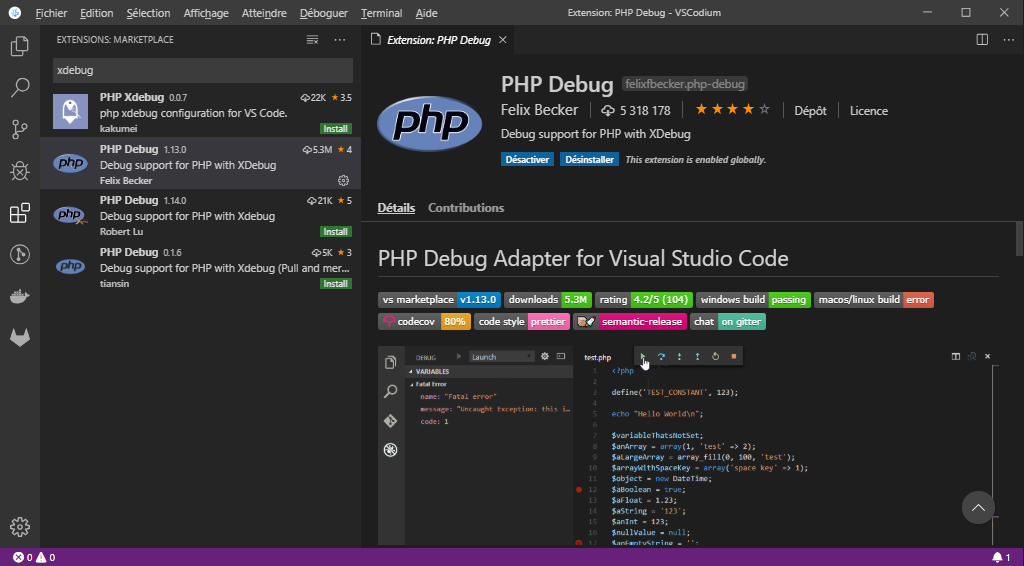
VSCode is a simple text editor. It’s the multiple available extensions that give it all its power and almost makes a complete IDE out of it. The one that interests us today enables us to place breakpoints in the code (even conditional breakpoints!), execute instructions step by step, explore variables… In short, everything we have the right to demand from a good debugger. It’s called PHP Debug and it’s edited by Felix Becker.
Installation of the extension
To install it in VSCode, we need to :
- Click on the “Extensions” icon (or Ctrl + Shift + X),
- then use the search field to find the extension (type xdebug),
- and finally install it (click on the little green “Install” button).

To work, you need PHP installed on your computer. We can check it’s installed by typing the php -version command in a console. It should output the currently installed version of PHP.

If not, you can download the last version (nonthread safe) on this site.
Configuration of a listener
The PHP Debug extension is able to manage many configurations if we need to listen to many instances of Xdebug. We are going to create only one here, for our container.
For that we need to :
- Click on the “debug” icon on the sidebar (or Ctrl + Shift + D),
- then click on the gear icon titled “Open launch.json” next to the drop-down menu at the top of the left side panel,
- then click on PHP in the list of proposed environments. A hidden folder named .vscode containing a file named launch.json is created in our project root folder.
We can easily deduce that the configuration of our extension is liked to our project, which is convenient because all of our projects don’t necessarily use Docker and will likely have different configurations.
Inside our launch.json file, we notice 2 configurations that we can delete (or not, doesn’t matter). We are gonna create a new one :
Line 5
We shall pay particular attention to the port number we use. It must identical to the one we gave in our docker-compose.yml file.
Line 6
The pathMapping must also be right. Do not use an absolute or relative path. We must use the variables VSCode provides us.
Line 9 ### Added on 11/11/2020
The hostname must be set to localhost. This is especially necessary when working with WSL2.
Lines 10 to 15
The xdebugSettings have been copied from the internet and can (must ?) be adjusted to our needs.
Now place to magic! Let’s actually see our code execute!
Let’s debug
Now that everything is ready, we're gonna be able to place our very first break-point!
For that, we need to open the index.php file (in VSCode) and place our pointer on the left of the line number before which we want to pause the execution. A dark red dot appears. If we click it becomes bright red and stays in place. The break-point is placed.
In the left side panel, we make sure that our configuration is the one selected in the drop-down menu, then we click on the little green triangle titled “Start debugging”.
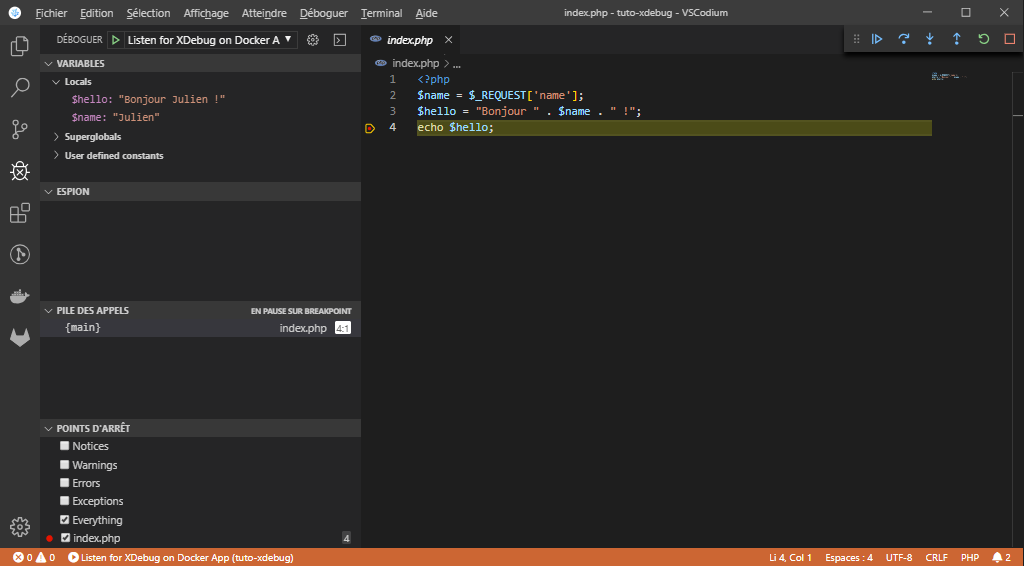
A new menu bar containing 6 buttons appears on the top-right corner of VSCode. It is now ready to intercept the next execution.
So finally we refresh our web page in the browser (localhost?name=Julien) and Tadaa! The execution stops on our break-point!

VSCode is highlighting the line on which the execution paused. In the left side panel, we can browse through the global and local variables and see their values.
We can also see the values of our local variables by hovering them directly in the code. The new menu bar on the top-right corner allows us to execute lines of code one by one, to stop the execution, or to release it and let it continue (to the next break-point!).
