In this article we are going to explain you the step by of How to debug COBOL?
This article uses the debugger in Mainframe Express to single-step an application. You can watch the flow of control through the COBOL source and use an extensive set of debugging facilities.
The debugging tool in Mainframe Express consists of a large number of interactive debugging facilities, many of which are used in this session.
The debugger was introduced briefly in the first session, Using Mainframe Express. This session goes deeper into the use of the debugger. You use the same demo application as you used in the chapter Using Mainframe Express.
0. Preparation
This demo uses the project idedemo.mvp that you created and built in the chapter Using Mainframe Express.
- If you have closed Mainframe Express, open it as before. Close any project windows and any other windows that are open.
- Open the project idedemo.mvp in any of the ways described in the chapter Start Here for the Tutorials.
The full path is \mfuser\projects\gsdemo\idedemo\idedemo.mvp. If you use Open on the File menu, you need the Files of Type field on the Open dialog box set to Project files (*.mvp) to see this file.
1. Starting debugging
To start debugging:
- Ensure the Files View is at the front.
- Ensure that in the left-hand pane either Project or Source or JCL is selected, then click vsamdemo.jcl in the right-hand pane.
- Click Start Debugging on the Debug menu.
- Click the JCL tab, then click OK.
As you saw in the chapter Using Mainframe Express, the Application Output window appears and shows the job steps as the JCL executes, then when the COBOL program is entered the source view window shown in below figure appears and execution pauses.
2. Stepping through Code and Examining Data
To step through the code:
- Click Step on the Debug menu or click
 on the toolbar.
This executes the highlighted line of code. The Step function on the menu and the
 button on the toolbar are completely equivalent.
If at any time during this session you inadvertently edit the displayed source code - for example by accidentally typing a letter - then when you try to execute the edited line you get "Execution point is on a modified line". You can undo the change by clicking Undo on the Edit menu, or using the equivalent shortcut key Ctrl+Z.
- Click
 twice more to reach and execute the line of code starting
 MOVE 1 TO SUBSCRPT ... - Click Debug on the Options menu.
- On the dialog box, ensure the checkbox by Show tool tips to examine data has a checkmark, and click OK.
- Put the mouse pointer on the data item
SUBSCRPT, without clicking, and wait a moment.With this option set, putting the mouse pointer on a data item displays the item's value. This is very quick and convenient, but you may not want this to happen every time you put the mouse on a data item. It's up to you whether you leave this option set or not.
Now let's go on to look at more advanced ways of viewing data items.
- Double-click the data item
SUBSCRPT.This displays a dialog box showing the value of the data item.
- Click Add to list on the dialog box.
An extra window appears showing the data item's name and value. It is called the Watch List window, or simply the Watch window.
- Without stepping further, double-click the data item
TEMP-SORT-RECORDa few lines further down the program; then click Add to list. - Click Step
 three more times to execute three more lines of code. See how the value of
 TEMP-SORT-RECORDchanges. - Click the + symbol to the left of
TEMP-SORT-RECORD. - Click on
TEMP-SALESREPin the Watch List. - Click the Toggle Hex/Text button
 on the right of the Watch List to show this field in hexadecimal. Click
  again to return to text.
 - Click the Monitor button
 .
.This displays this data item in a small separate monitor window as well as in the Watch List. If the monitor window isn't big enough to show the dataname or value in full, you can drag its edges to make it bigger.
3. Changing Data Values
To change the value of TEMP-SALESREP:
- Click
TEMP-SALESREPin the Watch List. - Click the data value
JOHN HAWKalongside TEMP-SALESREP. - In the new window that appears, alter the name to
JIM HAWK, then click Apply.You'll see in the monitor window and the Watch List that the value alters.
You can also use the Watch List to alter a value, as follows.
- In the Watch List for
TEMP-SALESREP, alter the name toJIM HAWKINS, then (with the Watch List still selected) press Enter. - Double click on
SORT-FILE. - Click Add to List.
- Click Step
 about a dozen times more and watch the values of your listed data items change
 - Close the monitor window by clicking its
 button.
 - Right-click in the Watch List window, and click Hide.
The Watch List window - and the Call/Perform Stack window, also used in debugging - behave like the Application Output window. If you click Dockable Windows on the View menu you'll see a dialog box for showing and hiding them. If you don't hide this window, it disappears when you stop debugging, but appears again every time you run or debug an application.
4. Finding Data Items
To find where data items are used in your program:
- Step about a dozen more statements, until the execution point (the highlighted line) is on the line
IF PERFORM-FLAG EQUAL TO 1. - Right-click any reference to
PERFORM-FLAG, and on the popup menu click COBOL Find "PERFORM-FLAG".This highlights all lines where this data item is referenced.
- Click Compress on the View menu, then click PERFORM-FLAG on the submenu that appears.
This compresses the listing to show just lines that reference PERFORM-FLAG. A note on the left of each line shows whether the line defines, modifies or tests the item. See Figure below.
- Click any one of these compressed lines and click Expand on the View menu.
This expands the listing again, positioned such that the line you had selected is visible on the screen.
- Again, click Compress on the View menu, then click PERFORM-FLAG .
- Click the second last use of
PERFORM-FLAG, that is, the line containingUNTIL PERFORM-FLAG EQUAL TO ZERO. - Again, click Expand on the View menu.
- Click Clear on the View menu, then click PERFORM-FLAG .
This removes the highlighting from the lines containing
PERFORM-FLAGYou can use these functions in exactly the same way on procedure-names.
5. Setting Breakpoints
To set a breakpoint:
- Right click on the line containing
CLOSE INQUIRY FOREIGN-REGION. - Click Set Breakpoint.
Notice the
 symbol that appears alongside the line.
 - Set four more breakpoints a few lines further down (in the PROCESS-INQUIRY paragraph) on the lines:
PERFORM WRITE-BAD-DATA(both occurrences)PERFORM WRITE-WEST-RECORDPERFORM WRITE-EAST-RECORD - Click the Run button
 .
.This runs the program without animation up to the first breakpoint. The display is not updated till the execution pauses at the breakpoint.
- Click
 several more times and see how the execution stops at the breakpoints.
 - Continue to click
 until the message "Attempting to stop application" appears and disappears, showing the application has completed.
 - To confirm the application has finished, click the Debug menu. You should find the Start debugging, Step, Run and Breakpoint functions enabled, and all other debugging functions disabled (grayed out).
- Click Breakpoint on the Debug menu, then click Clear All in Program.
This is a quick way of clearing all breakpoints. You can use this function while debugging or, as in this case, after you finish debugging.
6. Locating Parts of the Program
To locate various major parts of the program:
- Click Locate COBOL Section on the Search menu.
- Click Procedure Division to take you to the first statement in the Procedure Division.
- Do the same again and click Working-Storage to take you to the first data item inside Working-Storage Section.
- Do the same again and click File to take you to the first data item in the first file definition in the File Section.
You can use this function while debugging or, as in this case, after you finish debugging.
7. Displaying Program Statistics
To see a variety of COBOL reports:
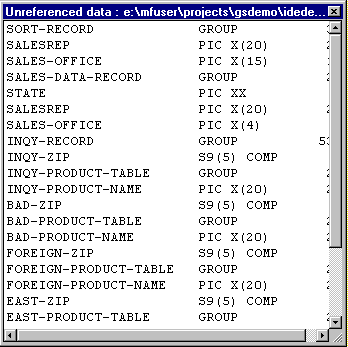
- Click Show COBOL Reports on the Search menu, then click Unreferenced Data.
This displays a list of all data items not directly referenced in the program. This window can be docked and undocked, like the Output window. By default is it undocked. It is shown in below figure.

Figure : Unreferenced data listClicking Dead Data would show you a list of all data in the program which is not referenced either directly or indirectly. This program has no dead data.
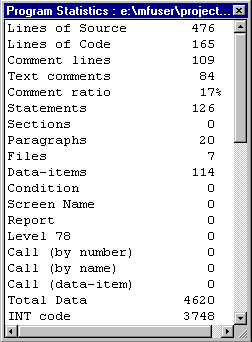
- Click Show COBOL Reports on the Search menu, then click Program Statistics.
This displays a list of statistics about this program, as shown in below figure You don't need to close the previous report first.
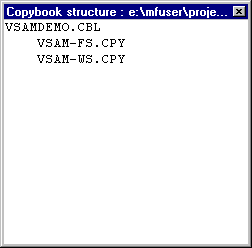
- Click Show COBOL Reports on the Search menu, then click Copybook Structure
This displays the window shown in below figure
- Double-click in this list on
VSAM-FS.CPYto take you to the start of the copybook in the main window. - Double-click in this list on
VSAM-WS.CPYto take you to the start of the other copybook. - Right-click on each report window and click Close on the popup menu. Close all the list and copybook windows you have opened.
This closes the report windows.
You can use this function while debugging or, as in this case, after you finish debugging.
8. Changing the Path of Execution
To demonstrate this function we will debug the program again.
- Click
 .
.When you are not currently debugging, the
 button is equivalent to Start Debugging on the Debug menu.
However, it only displays the Start Debugging dialog box if you have not previously run or debugged the application since loading or building the project. Otherwise, it assumes you want to start at the same place as previously, and goes straight into the debugging. (If you'd prefer it to display the dialog box always, you can click the Options menu, then Debug, and put a check mark by Step/Run displays Start Debugging dialog.)
- Click Run Through
 to execute
 PERFORM SORT-STATESas a single step. - Click
 .
.(You are now ready to execute the line
OPEN INPUT INQUIRY). - Right-click on the next line,
OPEN OUTPUT FOREIGN-REGION..., and click Skip to Cursor.This moves the execution point to the next line without executing the
OPEN INPUT. - Click
 a few times until you have executed the line
 READ INQUIRY.You get an error message, since you are trying to read a file that you have not opened.
- Click OK on the message, then move the cursor up about 12 lines to
OPEN INPUT..., right-click on the statement and click Skip to Cursor. - Click
 .
. - Cursor down about 11 lines to
READ INQUIRY..., right-click and click Skip to Cursor. - Click
 .
.The file is now read successfully.
- Click Stop Debugging on the Debug Menu.


